What you’ll learn
- Sales performance indicators to monitor
Get a weekly report into your team’s critical numbers to track progress, identify weak areas, and hit your number. - See where numbers are slipping
Don’t wait until it’s too late! The sales report template highlights mission-critical metrics from activity stats to pipeline gaps. - Pre-built formulas and reports
Enter rep data and the template will automatically populate with built-in excel formulas and reports for your team.
How to use the sales report template
- Update data
Enter weekly stats for each rep (activity, pipeline) and the template does the work for you. - Follow instructions included in the template
The template comes with instructions on how to update the data – the template works even if you don’t have a degree in Microsoft excel. - Generate your sales reports
Get clean, accurate data into your team’s activity, pipeline, and leaderboards to understand what’s working (and what isn’t) in your team’s performance.
Get the template and within seconds you’ll learn
- Who’s on top of the activity leaderboard
You’ve got a good feel for the top performers on your team. Get a snapshot of your activity leaderboard in a couple of clicks. - Reps booking the most weekly meetings
Meetings are critical to deal momentum, relationship building, and staying top of mind. See weekly bookings by rep. - Which reps make the most weekly calls
Can’t close deals without picking up the phone. See the weekly call activity for each rep and light a few fires if you need to. - Weekly account activity per rep
Get some hard activity data that helps explain why certain deals are stalling, stagnating, or falling off the map. - Who’s sending the most weekly emails
Emails are money! At least they can be. See weekly sales email activity for each rep and see where activity is falling short. - Weekly total pipeline coverage
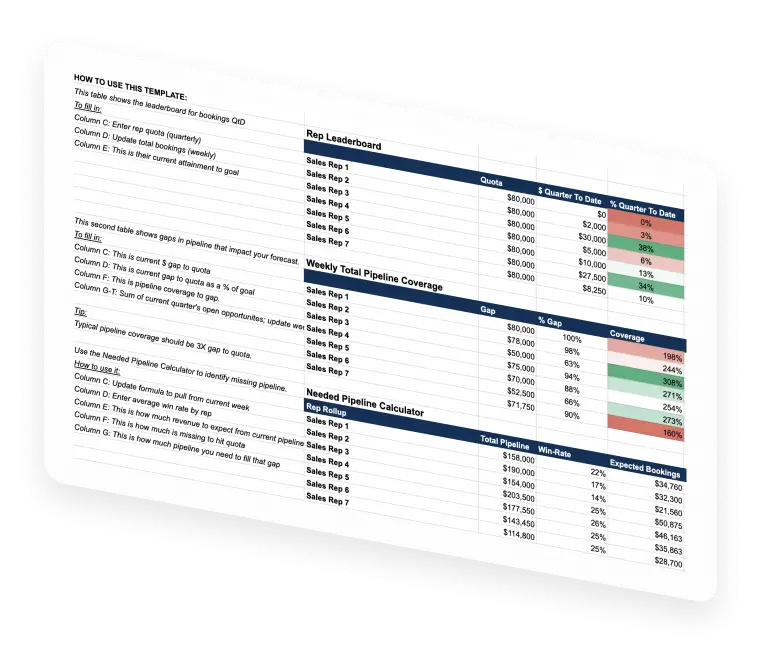
See the gaps in your pipeline that are impacting the accuracy of your sales forecast. Pro tip: pipeline coverage should be 3X gap to quota. - Rep leaderboard for bookings
Keep tabs on this critical pipeline metric. Just enter rep quota and total weekly bookings to see % goal attainment. - What’s missing from the pipeline
Use the Needed Pipeline Calculator to identify missing pipeline. You’ll see Win-Rate, Expected Bookings, and Expected Gap Pipeline Need, broken down by each rep.
What reports are included?
- Activity reports
Calls. Emails. Meetings booked. Accounts worked. The sales report template gives you an overview of crucial activity metrics for B2B sales teams. - Pipeline reports
Get a weekly report on pipeline coverage and calculate needed pipeline to close the gap between your bookings and your target. - Leaderboards
Automatically generate a leaderboard for activity and pipeline metrics so you know which reps to focus on.
FAQ
Who is the sales report excel template for?
If you manage a team of B2B sales reps, this is for you! The report gives you insights from two perspectives: Activity Metrics and Pipeline. It will help you evaluate reps, forecast, and even identify pipeline risk, all based on reality, not opinion.
What format does the report come in?
The sales report template is available as an excel file and as a Google Sheet. Regardless of which format you use, the value of the insights are exactly the same. Both versions include two important tabs: Activity Metrics and Pipeline.
Do I need to know Microsoft Excel to use this sales report template?
No.: This template comes with pre-built formulas so you only need to update the data in the excel spreadsheet and let the template do the rest. No need to be a master in Excel or Google Sheets—this template is built to be easy to use.
Do you have any other tips or sales reporting best practices?
The key to effective sales reporting is knowing which insights matter. We’re talking pipeline risk, activities of top performers, and which activities are most likely to lead to success. Easier said than done, which is why so many teams turn to sales reporting software to extract this intelligence.
How will the sales report template help me with my forecast?
We ran a study that revealed an astonishing stat: only 29% of leaders agree that their current forecasting process produces accurate results. Our sales report template dedicates an entire tab, including three core boards (Rep Leaderboard, Weekly Total Pipeline Coverage, and Needed Pipeline Calculator) that will help you forecast based on the facts. Oh, and if you need a little more guidance calling your numbers, check out How To Unlock Predictable Growth With Reality-Based Forecasting.
Which other metrics should I be tracking?
It’s so important to spot indicators early. It’s the best way to get reps back on track, save deals, and shore up gaps in the pipeline. Beyond the terrific insights you’ll gain from our sales report template, here are few other metrics to keep tabs on:
- Calls made
- Connect rate
- Calls longer than one minute
- Meetings booked
- Emails sent
- Email open rate
- Response rate
- Meetings booked
- Calls made
- Meetings set
- Questions asked
- Longest customer story
- Talk ratio
For an in-depth look into all of these metrics, check out Track These 7 Sales Analytics To Increase Team Performance.
THE BIG FAT SALES REPORT EXCEL TEMPLATE
Get your sales report template now (Excel and Google sheet link included)