Templates
The sales forecast template for sales managers (Excel)
Stab-in-the-dark forecasting? Committed deals pushing out? Low quota attainment? Use this sales forecast template (we built it in Excel) to start forecasting with accuracy, identifying gaps in your pipeline, and ensuring your team hits their number.
What you’ll learn
Roll up forecast
Use this Excel template to calculate your roll up forecast number using rep commits and information from pipeline reviews
Find pipeline gaps
Measure pipeline health and uncover spots where low pipeline coverage may hurt your forecast
Discover missing pipeline
Get the truth about how much pipeline your reps still need to get to hit your number
How to use the sales forecast template
- Fill-in-the-blanks sales forecast template
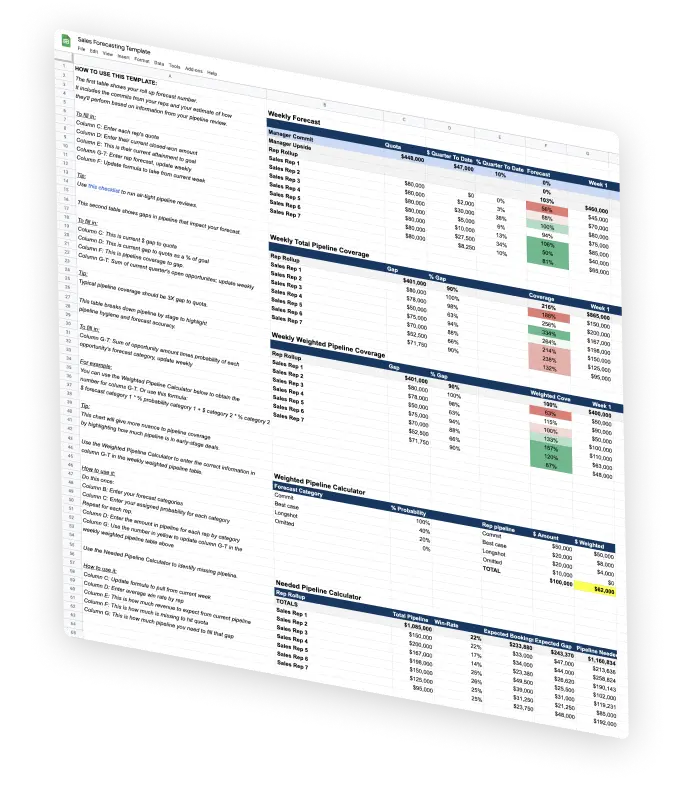
We did boring (yet critical) setup work leaving you with a few cells to input your team-specific numbers. Premade formulas make it super simple to see forecast data in minutes. - See it all
Weekly Forecast, Total Pipeline Coverage, Weighted Pipeline Coverage, Pipeline Calculator, and more. You want reports, this Excel template has ‘em. - Expandable & customizable
From 2 sales reps to 20, this sales forecast template is completely expandable and customizable to fit all sized teams. It’s time to assess your goals with far more accuracy.
Get the template and within seconds learn
- Rep commits
This will help you estimate how reps will perform based on information from your pipeline review. - Gaps in pipeline
See the critical gaps in your pipeline that will influence your forecast, including how much revenue is missing to hit quota. - Weekly opp updates
Get a quick snapshot of the current quarter’s open opps, which you can easily update on a weekly basis. - Pipeline coverage
Sometimes, at-a-glance pipeline coverage data only tells part of the story. Get a more nuanced look by seeing how much pipeline is in early-stage deals. - Pipeline by stage
See how the pipeline breaks down by stage to get an idea of pipeline hygiene and the accuracy of your forecast. - Weighted pipeline
Even more nuance for your pipeline review. See the breakdown based on close probability (i.e., Commit, Best case, and Omitted).
What’s included in this template
- Weekly Forecast
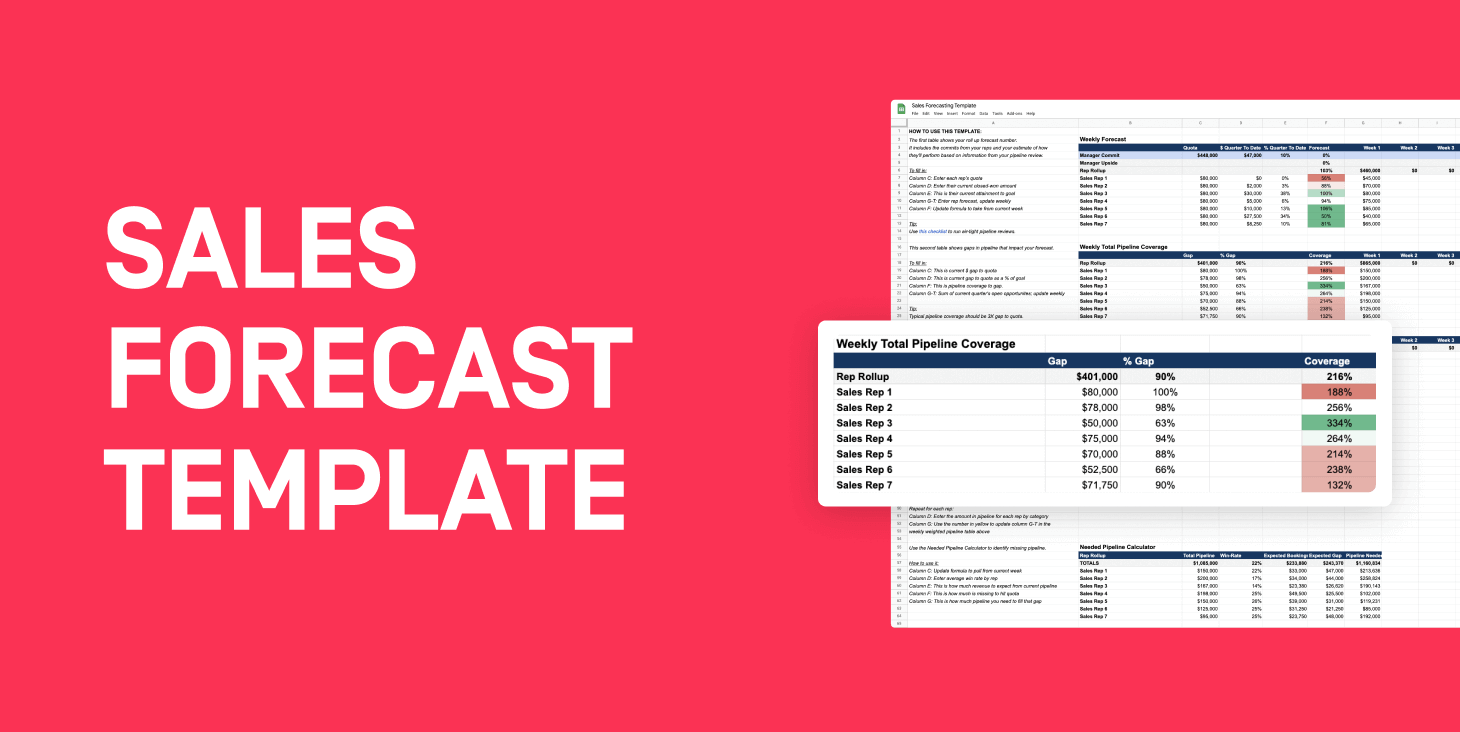
View your roll up forecast number — commits from your reps and your estimate of how they’ll perform - Weekly Total Pipeline Coverage
Review gaps in your pipeline that impact your forecast and increase chances you’ll finish below target. - Weighted Pipeline Calculator
Break down pipeline by stage to highlight pipeline hygiene and forecast accuracy.
GET THE SALES FORECAST TEMPLATE
Superhuman forecast accuracy. All in a straightforward Excel template.